Inventory
Use this page to see what your stock is worth, what's running low, where stock went, and how fast it sells.
Quick steps
- Click Reports in the top menu, then Inventory (under Inventory & products).
- Stock tab (opens first): read Total Inventory Value (at selling price) and the At cost figure under it. The Low Stock Warning card shows what's running low — click View in products to work through it.
- Movement tab: set From and To, click Filter, and see every stock change — sales, receipts, write-offs, counts — and who made it.
- Turnover tab: see dead stock, slow movers and fast sellers that need reordering. It starts on the last 90 days.
Common questions
The At cost figure looks far too low. Products with no cost count as $0. The line under the figure says how many — enter what you paid when you next check those products in.
We bought 40 and have 6 — where did they go? Open Movement, set the dates, and look at Stock Removed for that product. The detail list below shows every sale, write-off and count, line by line.
The Movement tab is empty. The range starts on today. Widen From and To and click Filter.
I don't see the Turnover tab. It's included on plans with advanced reports.
Can I export this report? There's no export button here. For stock and value as a spreadsheet, use Product Exports.
More detail: the three tabs, and opening Inventory
The Inventory page answers four questions in one place: what is my stock worth, what is running out, what happened to my stock, and how fast does it sell. It has three tabs:
| Tab | What it shows |
|---|---|
| Stock | What your stock is worth right now (at retail and at cost), value by category, and low stock. The tab it opens on. |
| Movement | Every stock change in a date range — a per-product summary and the line-by-line detail. |
| Turnover | How fast each product sells against the stock you hold: dead stock, slow movers, fast sellers to reorder, and turnover by category. On plans with advanced reports. |
Old links to the Inventory Turnover report open the Turnover tab.
Opening Inventory
- Log in to the Admin Panel.
- Click Reports in the top navigation bar.
- Click Inventory (under Inventory & products).
- Click a tab — Stock, Movement or Turnover.
Take a Tour at the top walks you through the tab you're on.
More detail: the Stock tab
Stock Tab
If your store runs two store types, a Store dropdown at the top narrows the tab to one side; click Filter.
Total Inventory Value
The first card values every active product that holds stock:
| Figure | What it means |
|---|---|
| Total Inventory Value | Stock on hand × what one unit sells for — what the shelf is worth at the till. For a product sold by weight that is its 1 g price (through its tier or preset pricing); for anything else, the cheapest way it sells. The line underneath says "Based on current stock and prices". The Turnover tab values stock the same way. |
| At cost | The same stock × what it cost you. This is the figure your accountant usually wants. |
| …stocked products have no cost yet | How many products that have stock on the shelf carry no cost at all. Shown only when there are some. |
A product's cost is the average of what you have paid for it when stock is checked in with a price (shown on the product's Inventory tab), or otherwise the Cost typed on the product's Pricing tab — see Stock Adjustments.
Products with no cost are counted as worth nothing in the At cost figure. That is why the count of them sits right underneath. If it is a big number, the at-cost value is understating your stock, not reporting it. Fix it by entering what you paid the next time each product is checked in.
Some products are left out of both value figures so nothing is counted twice:
- Bundles, combos and build-your-own buckets — their stock comes from the products inside them, which are valued on their own.
- Products with variations — the parent's stock is just the sum of its variations, which are valued on their own.
- Products below zero — stock sold past zero isn't worth anything, so it doesn't take value off the total either.
Low Stock Warning
The second card shows how many products are low — still have stock, but at or below their Low Stock Alert level — and, underneath, how many are out of stock. It only appears when something is low or out of stock. View in products opens exactly those low stock products on the Products page, so you can work down the list (the link is shown when the page covers all your stores, not a single Store).
The Low Stock Products table further down lists them, lowest stock first, 25 to a page. Click any column heading to sort. Full details of the columns, and of how the level is set, are in Low Stock Alerts.
Inventory Value by Category
A doughnut chart of the eight most valuable top-level categories, valued the same way as the card above. Each product is counted once, under its primary category, and subcategories are rolled up into the parent — so the slices add up rather than double-counting a product that sits in several categories.
Dual Store Breakdown
Stores running two store types (for example cannabis and general retail) get a Store Breakdown card (shown while Both Stores is selected): inventory value and low stock count for each side, and a bar showing how the value splits between them. Use the Store dropdown at the top of the Stock tab (or in the Movement tab's filter bar) to narrow the page to one side.
More detail: the Movement tab
Movement Tab
The Movement tab covers a date range, which starts on today.
- Set From and To.
- If your store runs two store types, pick a Store as well.
- Click Filter.
Stock Movement Summary
One row per product that moved in the range, most stock removed first:
| Column | Shows |
|---|---|
| Product | The product name, linking to the product. A product deleted since shows its name with (deleted), so its history still counts. |
| Stock Added | Everything that came in — receipts, check-ins, returns, voids, counts that found more. |
| Stock Removed | Everything that went out — sales, write-offs, check-outs, counts that found less. |
| Net Change | The two added together. |
| Transactions | How many separate movements made it up. |
| Current Stock | What that product holds right now, whatever the range says. |
This is the table for "we bought 40 and we have 6 — where did they go?"
Stock Adjustments (Detail)
Every movement, line by line, newest first, 50 to a page:
| Column | Shows |
|---|---|
| Date | When it happened. |
| Product | The product, linking to it. A product deleted since is marked (deleted) — a write-off doesn't disappear just because the product was removed afterwards. |
| Type | Sale, Void, Receive, Spoilage, Damage, Count, and the other kinds such as Check out, Location transfer or Transfer in. |
| Quantity | The change, in green when stock went up and red when it went down. |
| Details | The reason or note. Sales and voids link straight to the order. |
| User | Who did it. |
Nothing in this list can be edited or deleted — that is the point of it.
More detail: the Turnover tab
Turnover Tab
The Turnover tab shows how quickly your products are selling compared with the stock you have. It helps you find fast sellers that need restocking and slow or dead stock that ties up money and shelf space.
The Turnover tab is included on plans with advanced reports. If you don't see the tab, your plan doesn't include it.
Setting the Date Range
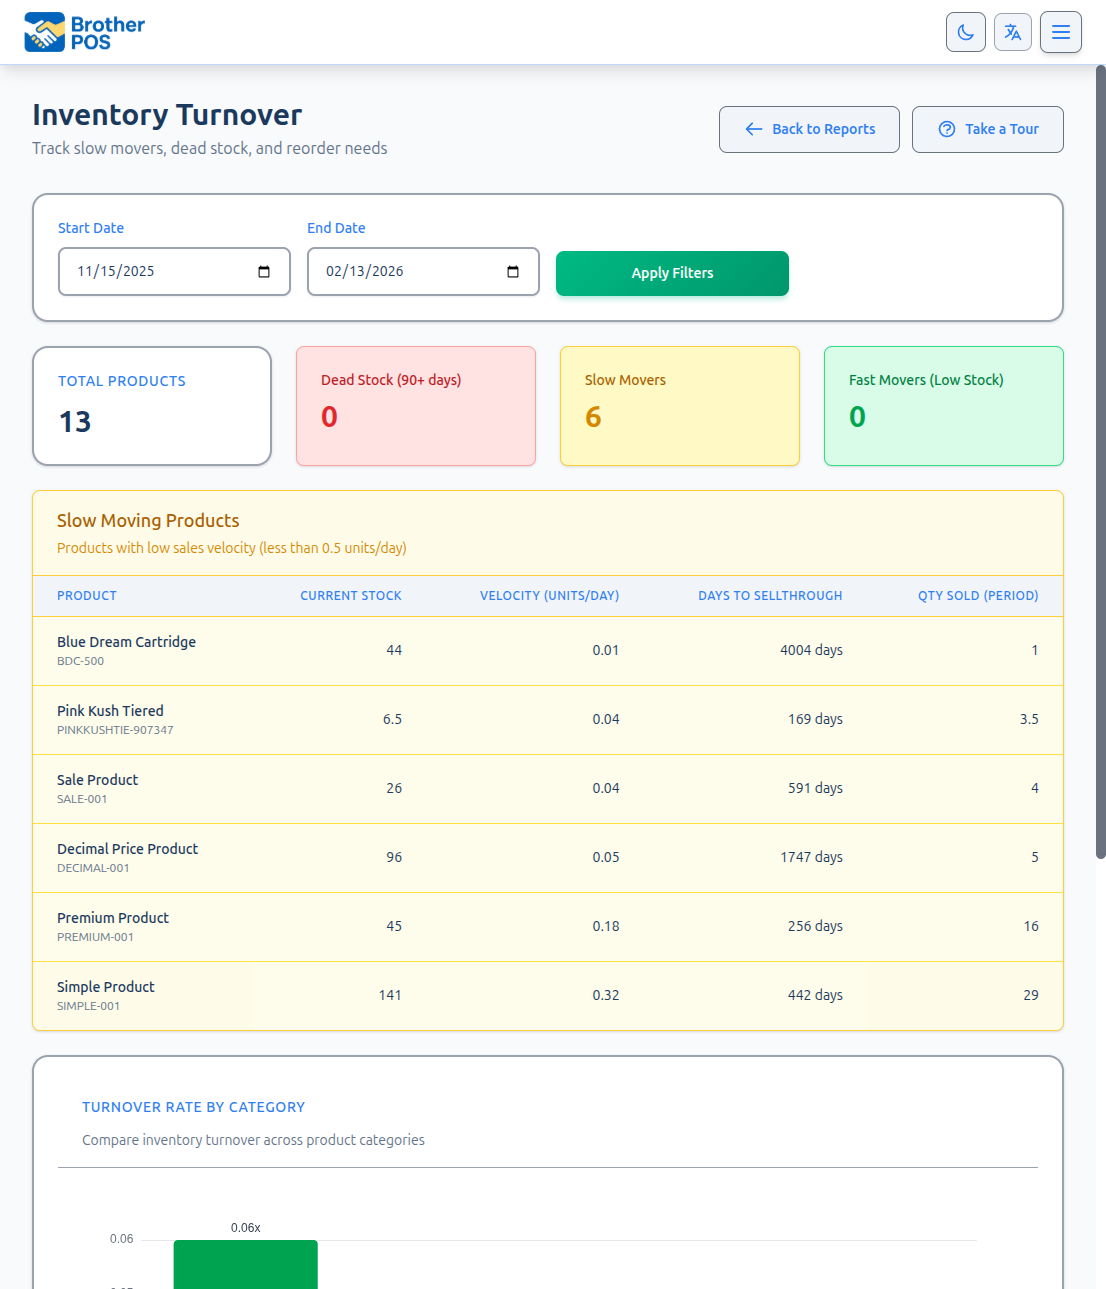
The Turnover tab opens on the last 90 days. Click a quick preset — This Week, Last Week, This Month, Last Month, This Quarter or Last 90 Days — or pick a Start Date and End Date and click Apply Filters. If your store runs in dual store mode, a Store dropdown is also shown.
The range sets which sales are used to measure how fast things sell. Stock levels are always your stock right now.
Short date ranges can be misleading. A product that sold 20 units in one week but none the next will look very different depending on which week you pick. Use at least 30 days for reliable figures.
Key Measures
Velocity
How many units of a product sold per day in the range:
Velocity = Units sold in the range ÷ Days in the range
Days to Sellthrough
Roughly how long your current stock will last at that pace:
Days to Sellthrough = Current stock ÷ Velocity
For example, 7 days means about a week of stock left; 90 days means three months' worth, which may mean you are overstocked.
Turnover Rate (categories only)
How many times a category's stock turned over in the range. It is shown in the category table only:
Turnover Rate = Units sold ÷ ((Current stock + Units sold) ÷ 2)
Use Days to Sellthrough and Days Until Out to plan purchase orders. If your supplier takes 5 business days to deliver, reorder before a product drops below 7-10 days of stock.
Report Layout
The report only looks at main products (not individual variations) that currently have stock that isn't zero.
Summary Cards
Total Products, Dead Stock (90+ days), Slow Movers and Fast Movers (Low Stock).
Dead Stock (No Sales in 90+ Days)
Products whose most recent sale ever was 90 or more days ago, longest-unsold first. This is based on the last sale date, not on your selected range. Columns: Product, Current Stock, Last Sale, Days Since Sale and Stock Value (current stock × what one unit sells for — the 1 g price for a weight product — the same valuation as the Stock tab).
A product with stock that has never been sold does not appear in the Dead Stock table or anywhere else on this report. Check for these separately, for example on the Stock tab.
Slow Moving Products
Products that sold in the range, but at less than half a unit per day, slowest first. Columns: Product, Current Stock, Velocity (units/day), Days to Sellthrough and Qty Sold (Period).
Fast Movers - Reorder Needed
Products selling faster than half a unit per day whose available stock is at or below the product's low stock threshold, fastest first. Products without a low stock threshold never appear here. Columns: Product, Current Stock, Low Stock Threshold, Velocity, Days Until Out and Revenue (Period) (net sales in the range: after discounts, before tax).
Turnover Rate by Category
A chart of the ten categories with the highest turnover, then a table of every top-level category — each product counted once, under the top-level category of its primary category, so a product filed only under a subcategory still counts — with Qty Sold, Current Stock, Turnover Rate, Velocity and Days to Sellthrough, highest turnover first.
Every column header in these tables can be clicked to sort.
What to Do With It
- Fast movers running low — reorder before they run out, allowing for your supplier's delivery time. Sort the table by Days Until Out and build a purchase order from it.
- Slow movers — run a sale, order less next time, or check the product is visible on the shelf and at the register.
- Dead stock — check the product is active and visible, mark it down, or write off stock that is expired or damaged. Seasonal products can go months without selling — compare with the same time last year first.
- Pair it with profit — a fast seller with a thin margin can earn less than a steady seller with a healthy one. Check the Sales Report's Profit tab alongside.
Limitations
- New products look slower than they really are if they launched part-way through the range, because velocity is spread over every day in the range.
- Out-of-stock periods are not excluded. A product that was out of stock for half the range will show lower sales than it would have with steady availability.
- Weighed products count their sales in their weight unit (for example grams), so compare them only with other weighed products.
- Negative stock is treated as zero when working out days to sellthrough.
More detail: troubleshooting and best practices
Troubleshooting
| Problem | Cause and fix |
|---|---|
| The At cost figure looks far too low. | Products with no cost count as zero. Check the "…products have no cost yet" line under it, and enter what you paid when you next check those products in. |
| Value at cost and value at price are miles apart. | That is your margin, and it is meant to be a gap. If it looks wrong, check for a product whose cost was typed as a whole case rather than per unit — or a weight product whose cost was typed for the whole bag. A weight product's cost is per gram. |
| A product I know is low isn't on the list. | It may be a variation. Only top-level products are listed — check the parent's Variations tab. Or it has run out completely, in which case it is in the out of stock count instead. |
| The Movement tab's tables are empty. | The range starts on today. Widen From and To and click Filter. |
| A movement I expected isn't in the detail list. | Check the date range first, then the Store filter if your store runs two store types. |
Best Practices
- Check the value at cost monthly and keep a note of it. It is the figure your books need, and it only makes sense compared with last month's.
- Drive the no-cost count to zero. Every product with stock should have a cost — enter what you paid when you check stock in, or when you receive at the register.
- Use the range, not the total. When a number looks wrong, set the range around the day it went wrong and read the detail list.
- Read the removals. A product with large removals that were not sales is where shrinkage shows up first.
What's Next?
- Low Stock Alerts — Set each product's low stock level and act on the list; the Turnover tab's fast movers depend on it.
- Stock Adjustments — Check stock in with what it cost, check it out with a reason, and correct counts.
- Sales Report — Profit tab — What your stock earns once it sells.
- Category Performance — Review revenue and volume by category.
- Product Exports — Stock and value as a spreadsheet.