Customer Analytics
The Customer Analytics report helps you understand who your customers are and how they shop. It identifies your most valuable customers, tracks purchase frequency, and calculates average spending metrics -- all of which inform your marketing, loyalty, and inventory decisions.
Accessing the Report
- Log in to the Admin Panel.
- Click Reports in the top navigation bar.
- Click Customer Analytics.
Report Sections
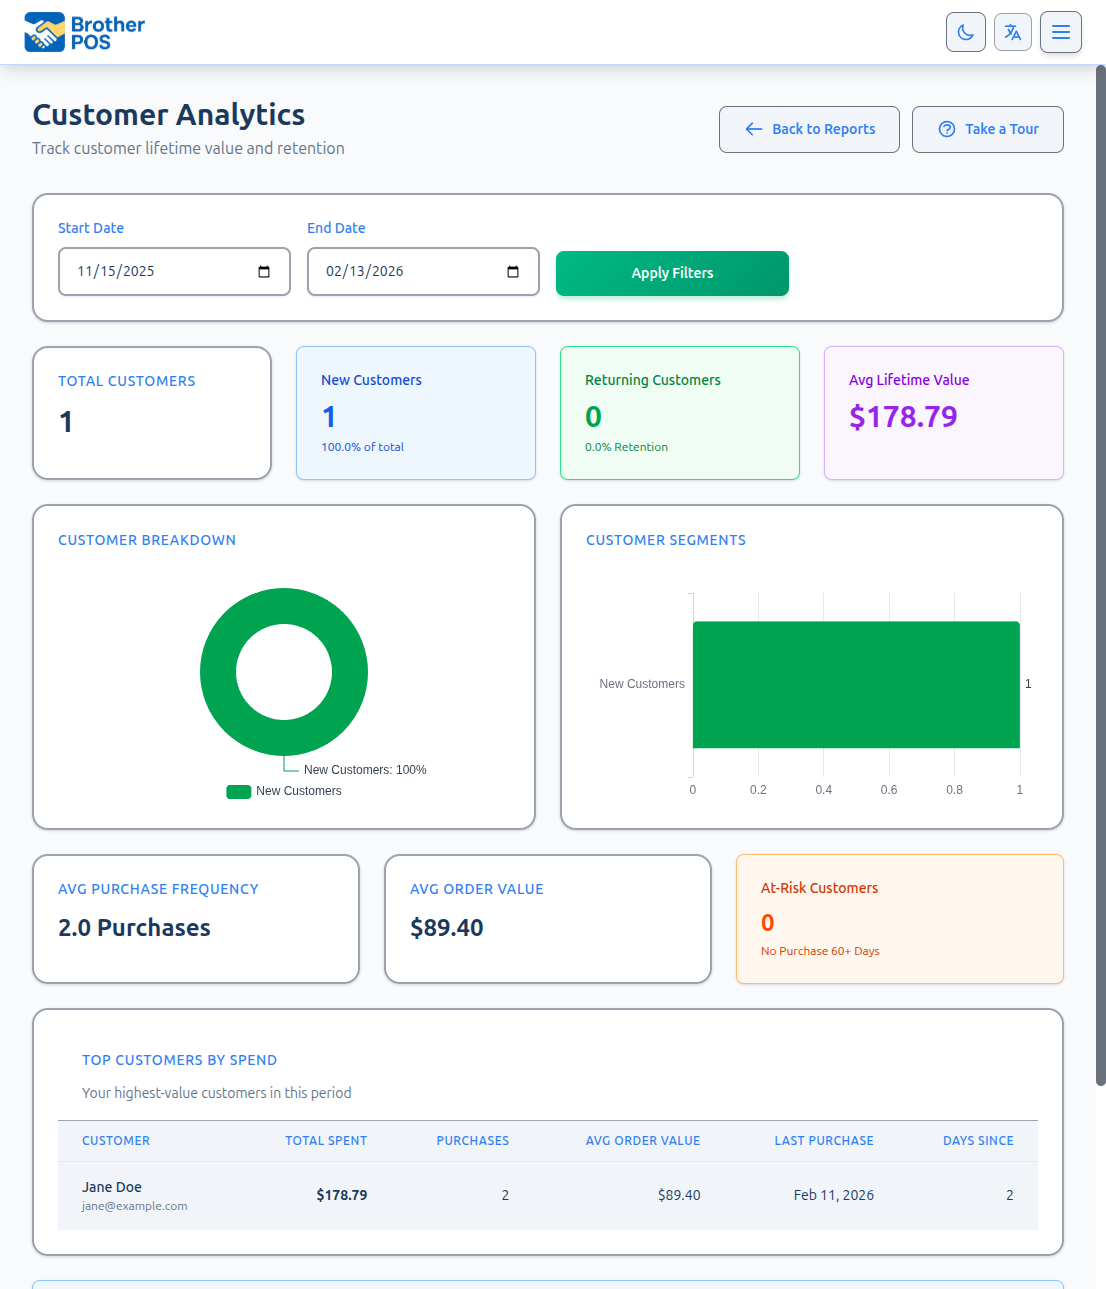
Top Customers
The top customers table ranks your customers by total spending over the selected period:
| Column | Description |
|---|---|
| Customer | Customer name |
| Transactions | Number of completed purchases |
| Total Spent | Sum of all purchase totals |
| Avg. Transaction | Average value per purchase |
| Last Visit | Date of most recent purchase |
Your top 10-20 customers often represent a disproportionate share of revenue. Consider creating a VIP loyalty tier or offering personalized service to retain these high-value shoppers. See Loyalty Tiers for configuration.
Purchase Frequency
This section shows how often customers return to your store:
| Metric | Description |
|---|---|
| Unique Customers | Number of distinct customers who made a purchase |
| New Customers | Customers who made their first-ever purchase in this period |
| Returning Customers | Customers who had previous purchases before this period |
| Return Rate | Percentage of customers who made more than one purchase |
| Avg. Visits per Customer | Average number of transactions per unique customer |
Spending Metrics
Aggregate spending statistics for the period:
| Metric | Description |
|---|---|
| Average Spend per Visit | Total revenue divided by total customer transactions |
Setting the Date Range
- Use the Start Date and End Date fields.
- Click Apply to refresh the report.
Recommended Periods
| Period | Use Case |
|---|---|
| Last 30 days | Current customer activity snapshot |
| Last 90 days | Identifying regular vs. occasional customers |
| Last 12 months | Long-term customer behavior patterns |
Transactions completed without attaching a customer profile are not included in Customer Analytics. To get the most value from this report, encourage cashiers to look up or create customer profiles for each sale.
New vs. Returning Customers
Understanding the balance between new and returning customers is critical:
Healthy Ratios
- A store with mostly returning customers has strong loyalty but may not be growing.
- A store with mostly new customers is acquiring well but may have a retention problem.
- The ideal mix depends on your store's maturity and location.
Tracking Over Time
Run the report for several consecutive months and track:
- Is the number of new customers per month growing, flat, or declining?
- Is the return rate improving over time?
- Are your top customers consistent, or does the list change frequently?
Interpreting Customer Data
High Spend, Low Frequency
Customers who spend a lot per visit but come infrequently may:
- Live far away and batch their purchases.
- Be buying for events or special occasions.
- Respond well to a "we miss you" outreach or loyalty incentive.
Low Spend, High Frequency
Customers who visit often but spend little may:
- Be buying single items or small quantities.
- Respond well to bundle deals or upselling.
- Be loyal customers worth cultivating with better product recommendations.
Declining Top Customers
If a previously top-ranked customer drops significantly in spending:
- Check their last visit date -- they may have stopped coming.
- Consider reaching out if your store has a relationship with them.
- Review whether a competitor opened nearby or if your product mix changed.
Customer analytics data should be used responsibly. Avoid sharing individual customer spending details with non-management staff. Use the data for business decisions, not for singling out customers.
Using Customer Analytics for Business Decisions
Loyalty Program Optimization
- Review the spending distribution -- are rewards attainable for most customers, or only the top spenders?
- Check the return rate -- is your loyalty program actually driving repeat visits?
- Look at average visits per customer -- this should increase over time if your loyalty program is working.
Marketing Decisions
- Target re-engagement campaigns at customers who have not visited in 30+ days.
- Create special offers for your top 20 customers to reinforce their loyalty.
- Use the new customer count to measure the effectiveness of advertising campaigns.
Staffing and Service
- If your busiest customer traffic day aligns with a high number of unique customers, ensure adequate staffing.
- Train staff to recognize top customers and provide exceptional service.
Product Mix
- Cross-reference your top customers' purchase histories with your product catalog.
- If top customers consistently buy specific categories, ensure those categories are well-stocked.
- Consider surveying top customers about new products they would like to see.
Filtering Options
The report has a store type filter (cannabis/general/both) to narrow results by product type. This filter only appears when your store has dual store mode enabled. If dual store mode is not enabled, this filter is not shown.
Common Questions
Why are some sales not showing in customer analytics? Only sales linked to a customer profile appear in this report. Cash sales without a customer profile are counted in the Sales Report but not here.
Can I see what specific products a customer buys? The Customer Analytics report shows aggregate metrics. For individual purchase history, go to Customers > [Customer Name] and view their transaction history.
Does the report include online orders? Yes, if the online order is linked to a customer profile in Brother POS (via WooCommerce sync).
What's Next?
- Customer Management -- View and edit individual customer profiles.
- Loyalty Setup -- Configure your loyalty program based on analytics insights.
- Sales Reports -- See the full revenue picture including anonymous sales.
- Exporting Reports -- Export customer data for external analysis or mail campaigns.