Margin Analysis
The Margin Analysis report helps you understand the profitability of your sales. It compares revenue against product costs to calculate gross margin and markup percentages, giving you insight into which products and categories deliver the most profit.
Accessing Margin Analysis
- Log in to the Admin Panel.
- Click Reports in the top navigation bar.
- Click Margin Analysis.
How Margins Are Calculated
Brother POS uses two related but distinct metrics:
Gross Margin
Gross margin expresses profit as a percentage of the selling price.
Gross Margin = ((Revenue - Cost) / Revenue) x 100
Example: A product sells for $50 and costs $30.
- Margin = (($50 - $30) / $50) x 100 = 40%
Markup
Markup expresses profit as a percentage of the cost.
Markup = ((Revenue - Cost) / Cost) x 100
Example: The same product at $50 with a $30 cost.
- Markup = (($50 - $30) / $30) x 100 = 66.7%
Margin percentage uses actual sale revenue from historical transactions. Markup percentage uses current catalog prices (product_price - product_cost), not historical sale prices. This means margin reflects what actually happened, while markup reflects the current pricing structure. Keep this distinction in mind when reviewing the report over long time periods.
Report Sections
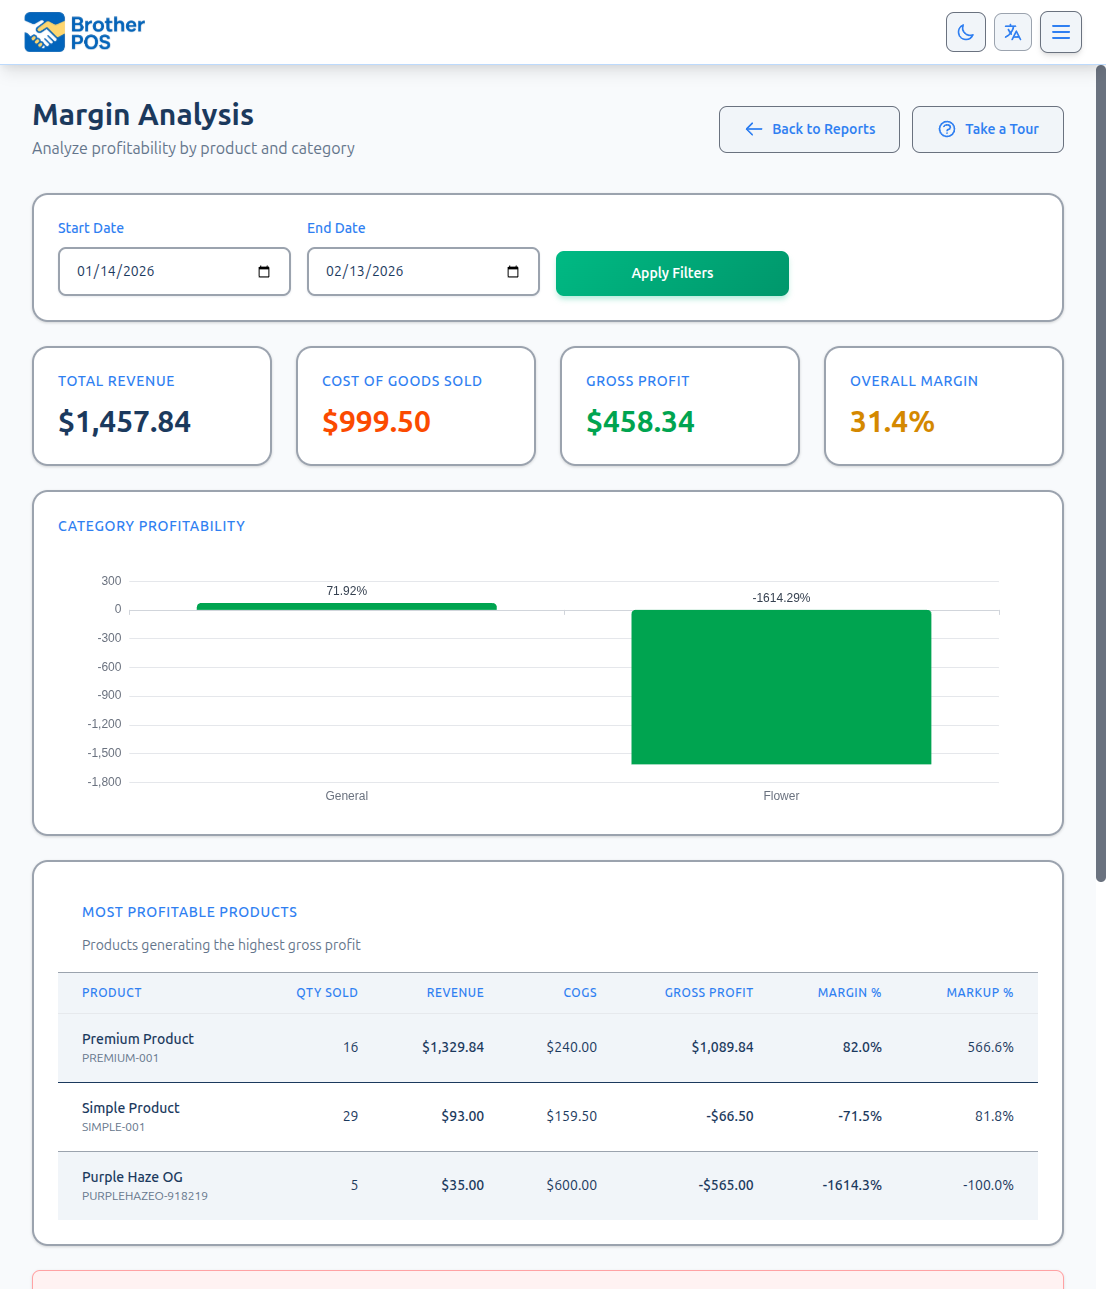
Overall Summary
At the top of the report, you will see aggregate numbers for the selected date range:
| Metric | Description |
|---|---|
| Total Revenue | Sum of all completed sale line items |
| Total Cost | Sum of product costs for all items sold |
| Gross Profit | Revenue minus cost |
| Average Margin | Weighted average gross margin percentage |
Product-Level Analysis
Each product that was sold during the period appears in a table:
| Column | Description |
|---|---|
| Product | Product name and SKU |
| Units Sold | Quantity sold during the period |
| Revenue | Total revenue from this product |
| Cost | Total cost of goods sold |
| Profit | Revenue minus cost |
| Margin % | Gross margin percentage |
| Markup % | Markup percentage |
The table is sortable by any column. Click a column header to sort ascending; click again for descending.
Category-Level Summary
Below the product table, margins are aggregated by product category:
- Category Name
- Total Revenue for the category
- Total Cost for the category
- Category Margin %
- Category Markup %
This view helps you identify which categories are most profitable overall, regardless of individual product performance.
Setting the Date Range
- Use the Start Date and End Date pickers at the top of the report.
- Click Apply to refresh the data.
Interpreting the Data
High Revenue, Low Margin
A product with strong sales but low margin may be:
- A loss leader -- intentionally priced low to drive foot traffic.
- Underpriced -- the cost has increased but the retail price was not adjusted.
- Action needed -- consider raising the price or finding a cheaper supplier.
Low Revenue, High Margin
A product with few sales but a high margin may be:
- A niche product -- valuable but appeals to a smaller customer base.
- Under-promoted -- consider featuring it in campaigns or displays.
- Overpriced -- the high margin might be suppressing sales volume.
Negative Margin
A negative margin means you are selling the product below cost. This requires immediate attention unless it is an intentional clearance strategy.
If you see products with negative margins, investigate immediately. Common causes include:
- Cost price was entered incorrectly (too high).
- A deep discount campaign is running that pushes the effective price below cost.
- The retail price was set incorrectly (too low).
Fix the underlying issue in Products > Edit Product before more inventory sells at a loss.
Using Margin Data for Decisions
Price Adjustments
- Sort the product table by Margin % ascending to find your lowest-margin products.
- For each low-margin product, decide whether to:
- Raise the retail price.
- Negotiate a lower cost with your supplier.
- Discontinue the product if it cannot be made profitable.
Category Strategy
- Review the category-level summary.
- Compare margins across categories to understand where your profit comes from.
- Consider expanding inventory in high-margin categories.
- Evaluate whether low-margin categories are worth the shelf space.
Campaign Planning
Before launching a sale campaign or freebie promotion:
- Check the margin of the products you plan to discount.
- Ensure that even after the discount, the effective margin remains acceptable.
- Use the Margin Analysis report after the campaign to measure its profitability impact.
The accuracy of your margin data depends entirely on correct cost prices in your product catalog. Make it a habit to update cost prices whenever you receive new inventory, especially if supplier pricing has changed.
Filtering the Report
The report has a store type filter (cannabis/general/both) to narrow results by product type. This filter only appears when your store has dual store mode enabled. If dual store mode is not enabled, this filter is not shown.
Limitations
- Markup uses current catalog prices -- As noted above, margin percentage uses actual sale revenue, but markup percentage uses current catalog prices (product price minus product cost). If you change prices after the reporting period, the markup column will reflect the new prices, not the prices at the time of sale.
- Products without cost -- Products that do not have a cost price set will show a 100% margin, which is misleading. Ensure all products have accurate cost prices.
What's Next?
- Category Performance -- See revenue and unit performance by category.
- Inventory Turnover -- Understand how quickly products sell.
- Sales Reports -- Review the actual revenue collected at the register.
- Exporting Reports -- Export your margin data for analysis in a spreadsheet.