Category Performance
Category performance data is displayed as a section within the Sales Report, not as a separate report page. There is no dedicated Category Performance page with its own URL, date range, or filters. To view category performance, navigate to Reports > Sales Report.
Accessing Category Performance Data
- Log in to the Admin Panel.
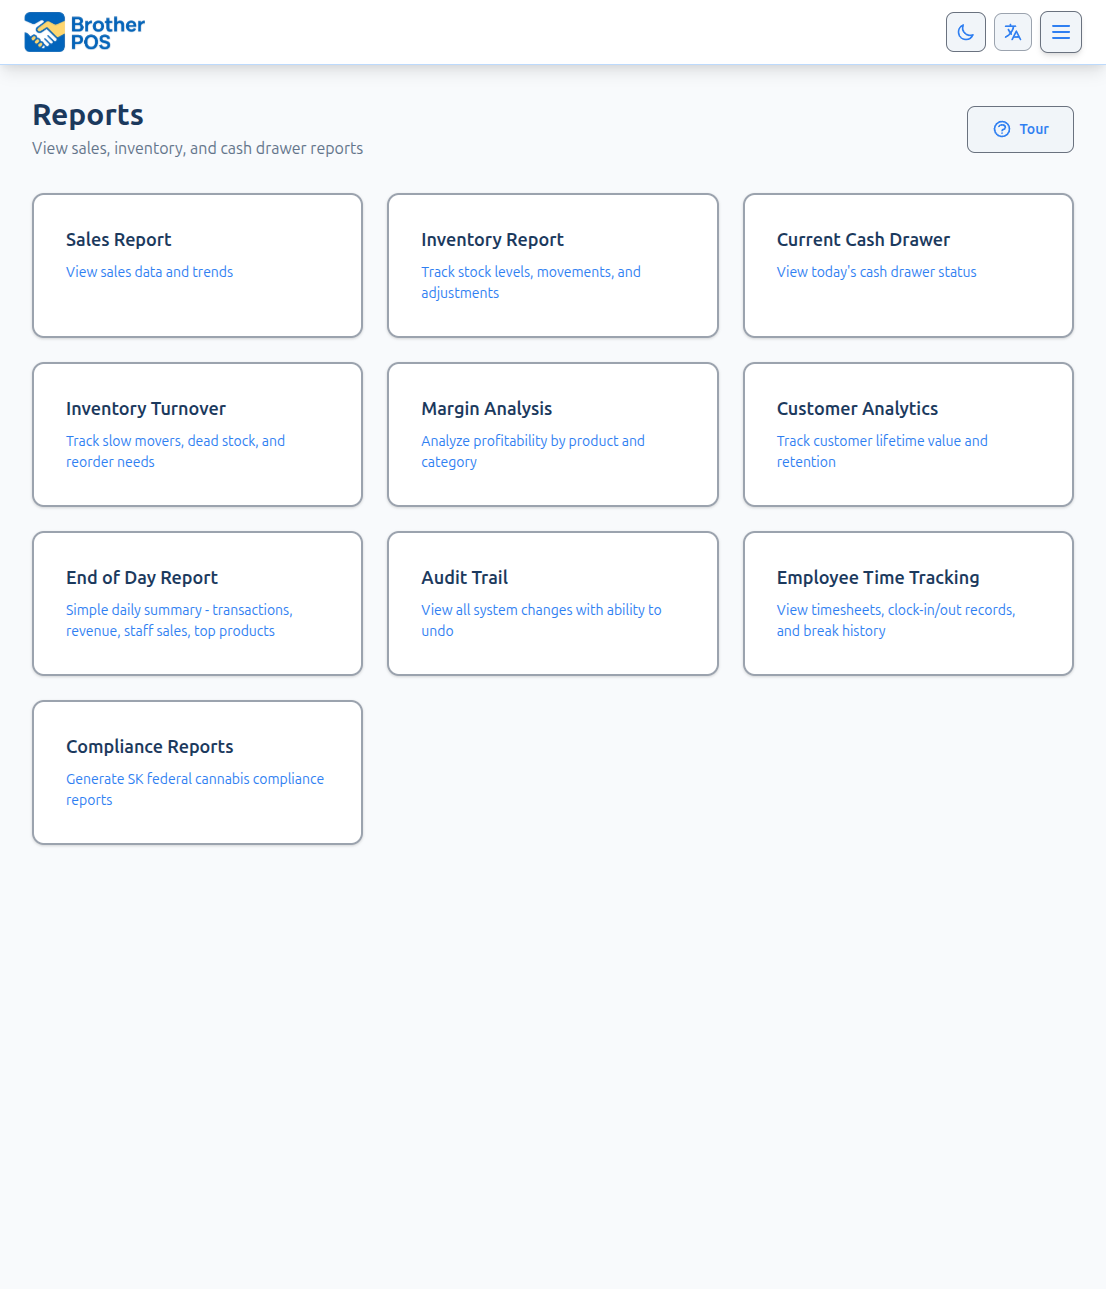
- Click Reports in the top navigation bar.
- Click Sales Report.
- Scroll down to the category performance section within the Sales Report.
The category performance data uses the same date range as the Sales Report. There are no separate date range controls or filters for this section.
What the Section Shows
The category performance section within the Sales Report shows aggregate data by product category for the selected date range:
- Category Name -- The product category.
- Revenue -- Total revenue generated by products in this category.
- Sales -- Number of transactions that included products in this category.
- Avg Sale Value -- Average sale value for transactions in this category.
- % of Revenue -- This category's share of total store revenue.
- Units Sold -- Total units sold across all products in this category.
This view helps you identify which departments carry your business and how revenue is distributed across product categories.
Example:
| Category | Revenue | % of Revenue |
|---|---|---|
| Flower | $45,000 | 52% |
| Edibles | $18,000 | 21% |
| Pre-Rolls | $12,000 | 14% |
| Accessories | $7,000 | 8% |
| Concentrates | $4,500 | 5% |
In this example, Flower and Edibles together account for 73% of revenue.
Using Category Data for Decisions
Shelf Space Allocation
Categories with high revenue deserve the most prominent shelf space and the widest product selection. Categories with low revenue should be evaluated for reduction.
Purchasing Priorities
When allocating your purchasing budget:
- Ensure your top 3-4 categories are fully stocked.
- Consider reducing purchase orders for underperforming categories.
- Test new products in high-performing categories before low-performing ones.
Staff Training
Identify your highest-revenue categories and train your staff to recommend products in those categories when appropriate.
In most retail stores, roughly 80% of revenue comes from 20% of categories. Use this data to identify your core categories and ensure they are well-stocked, well-priced, and well-merchandised.
Related Reports
For deeper analysis beyond the category section in the Sales Report:
- Margin Analysis -- Drill into individual product margins and see category-level margin summaries.
- Inventory Turnover -- Check how fast products sell, filterable by category.
- Sales Reports -- View the overall sales picture with payment breakdowns.