Inventory Turnover
The Inventory Turnover report shows how quickly your products are selling relative to the stock you have on hand. It helps you identify fast movers that need frequent restocking and slow movers that tie up capital and shelf space.
Accessing the Report
- Log in to the Admin Panel.
- Click Reports in the top navigation bar.
- Click Inventory Turnover.
Key Metrics
Turnover Rate
The turnover rate measures how many times a product's stock has been completely sold and replaced during a period.
Turnover Rate = Units Sold / Average Stock on Hand
- A turnover rate of 12 means the product sells through its entire stock approximately once per month (over a year).
- A turnover rate of 1 means it takes the entire period to sell through the stock once.
Days of Supply
Days of supply estimates how long your current stock will last at the current sales rate.
Days of Supply = Current Stock / Average Daily Sales
- 7 days of supply means you have about one week of stock remaining.
- 90 days of supply means you have three months of stock -- which may indicate overstocking.
Use the Days of Supply metric to plan purchase orders. If your supplier takes 5 business days to deliver, you want to reorder when a product drops below 7-10 days of supply to avoid stockouts.
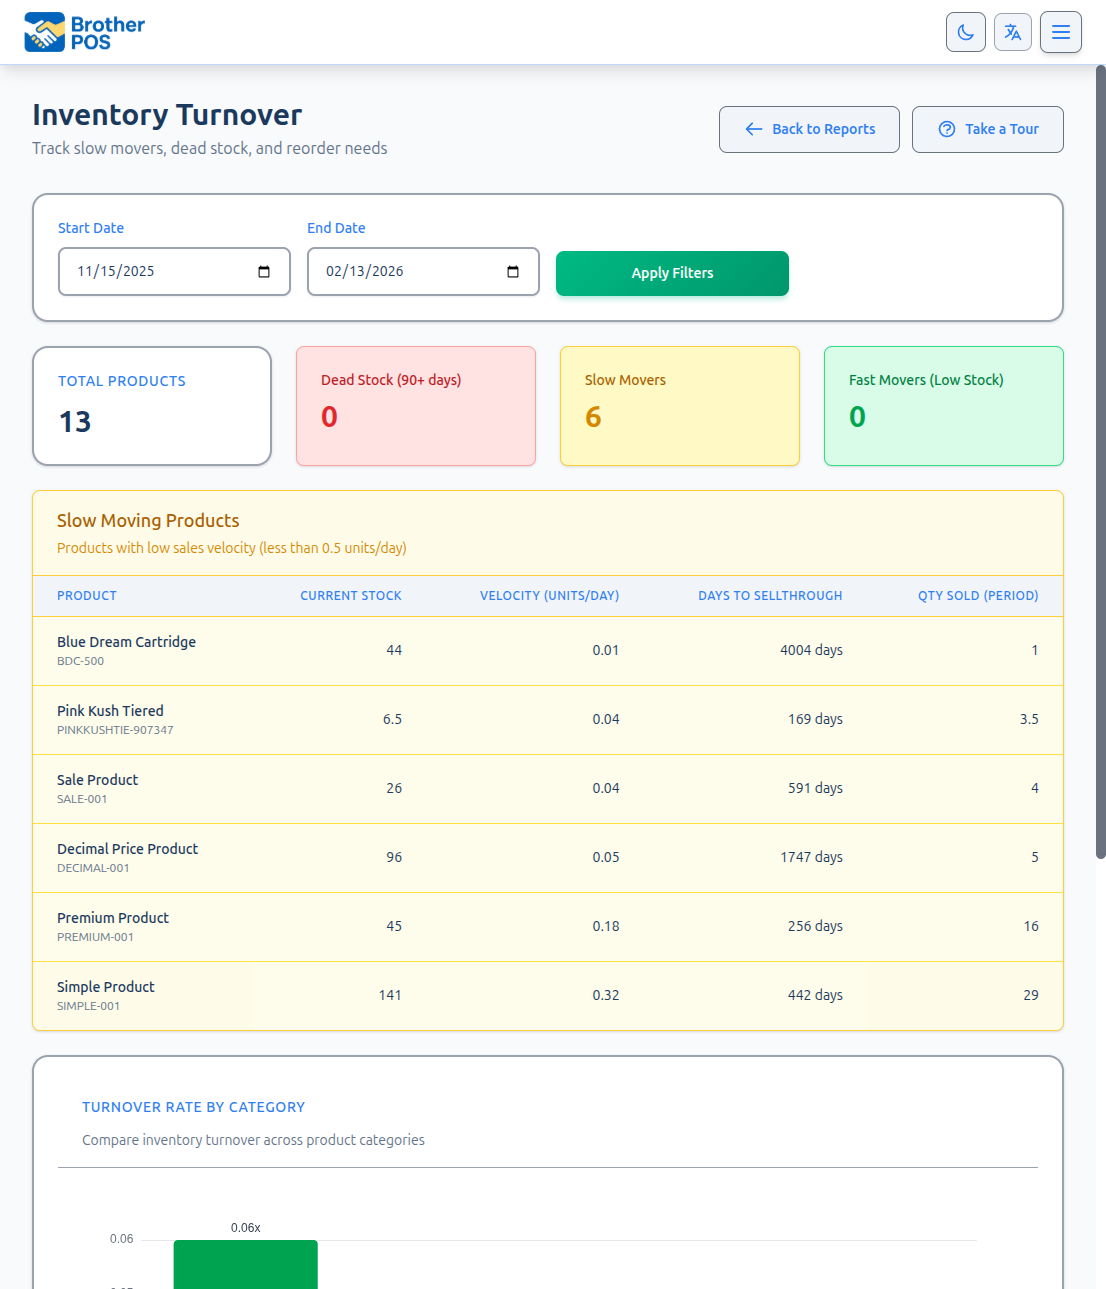
Report Layout
The report is organized into three separate color-coded product tables and a category summary table:
Dead Stock (Red)
Products with zero sales during the selected period. These items are tying up capital and shelf space. The table lists product name, current stock, and other relevant details.
Slow Movers (Yellow/Amber)
Products with low sales velocity relative to their stock levels. These products are selling, but slowly enough to warrant attention.
Fast Movers (Green)
Your best-selling products with high turnover rates. These items need frequent restocking and are the core of your revenue.
Category Turnover Table
Below the product tables, a category-level summary aggregates turnover data by product category, helping you evaluate inventory health at the department level.
Setting the Date Range
The period you select determines the sales data used for turnover calculations.
- Use the Start Date and End Date fields at the top.
- Click Apply to refresh.
The default date range is 90 days ago to today.
Recommended Periods
| Period | Best For |
|---|---|
| Last 30 days | Weekly reorder decisions and short-term planning |
| Last 90 days | Monthly purchasing reviews, smoothing out weekly fluctuations |
| Last 365 days | Annual strategy, identifying seasonal products |
Short date ranges can be misleading. A product that sold 20 units in one week but zero in the next will look very different depending on which week you select. Use at least 30 days for reliable turnover data.
Interpreting the Data
Fast Movers (High Turnover)
Products with high turnover rates and low days of supply are your best sellers.
Actions to consider:
- Increase reorder quantities to avoid stockouts.
- Negotiate volume discounts with suppliers.
- Ensure these products have prominent shelf placement.
- Monitor for price increase opportunities -- high demand may support a higher price.
Slow Movers (Low Turnover)
Products with low turnover rates and high days of supply are not selling quickly.
Actions to consider:
- Run a sale campaign to move the stock.
- Reduce future order quantities.
- Consider discontinuing the product if it consistently underperforms.
- Check if the product is properly merchandised and visible to customers.
Dead Stock (Zero Sales)
Products with zero sales during the selected period are dead stock.
Actions to consider:
- Verify the product is active and visible in the POS catalog.
- Check if it has been out of stock (zero current stock would explain zero sales).
- Mark it down aggressively for clearance.
- Write off the inventory if it is expired, damaged, or unsaleable.
Before marking a product as dead stock, consider seasonality. Holiday items, summer products, or seasonal flavors naturally have periods with zero sales. Compare against the same period last year before making discontinuation decisions.
Sorting
Click any column header within a table to sort the data:
- Sort by Days of Supply (ascending) to see products closest to stockout first. Use this for urgent reorder planning.
- Sort by Turnover Rate (descending) to see your fastest-selling products first.
- Sort by Units Sold (descending) to find your volume leaders.
Using Turnover Data for Purchasing
Building a Reorder List
- Set the date range to the last 30 days.
- Sort by Days of Supply ascending.
- Review products with fewer than 10 days of supply.
- For each product, consider your supplier's lead time.
- Create a purchase order for products that will run out before the next delivery.
Optimizing Stock Levels
- Set the date range to last 90 days for a stable view.
- Identify products with more than 60 days of supply.
- For these products, reduce your next order quantity.
- Redirect purchasing budget to high-turnover products.
Category-Level Strategy
- Review the category turnover table and note the average turnover rate for each category.
- Categories with consistently low turnover may need:
- Fewer SKUs (trim the selection).
- Better pricing (the category may be overpriced).
- Improved merchandising.
A product with high turnover but low margin may earn less total profit than a product with moderate turnover and high margin. Use the Margin Analysis report alongside turnover data to find the optimal balance between volume and profitability.
Limitations
- New products will show artificially high turnover if they launched mid-period, because the calculation uses the full period length.
- Out-of-stock periods are not excluded. A product that was out of stock for half the period will show lower sales than it would have achieved with continuous availability.
- Weight-based products report turnover in the unit configured in the product (e.g., grams). Compare these products only against others with the same unit.
What's Next?
- Margin Analysis -- Check whether your fast-selling products are also profitable.
- Category Performance -- Review revenue and volume by category.
- Low Stock Alerts -- Set up automatic notifications when products run low.
- Exporting Reports -- Download turnover data for spreadsheet analysis.