Sales Reports
The Sales Report is your primary tool for understanding how your store is performing. It shows total revenue, transaction counts, payment method breakdowns, and trends over any date range you choose.
Accessing Sales Reports
- Log in to the Admin Panel at
storename.brotherpos.ca. - Click Reports in the top navigation bar.
- Click Sales Report.
The report loads with the current month to date (first day of current month through today) selected by default.
Setting a Date Range
Every sales report starts with a date range selection. You can analyze a single day, a full month, or any custom range.
Using the Date Picker
- Click the Start Date field and select the beginning of your desired range.
- Click the End Date field and select the end of your range.
- Click Apply to refresh the report.
Select start and end dates using the date picker fields.
All dates and times are displayed in your store's configured timezone. If your report does not match your expectations, verify the timezone setting under Settings > Edit Settings > General tab.
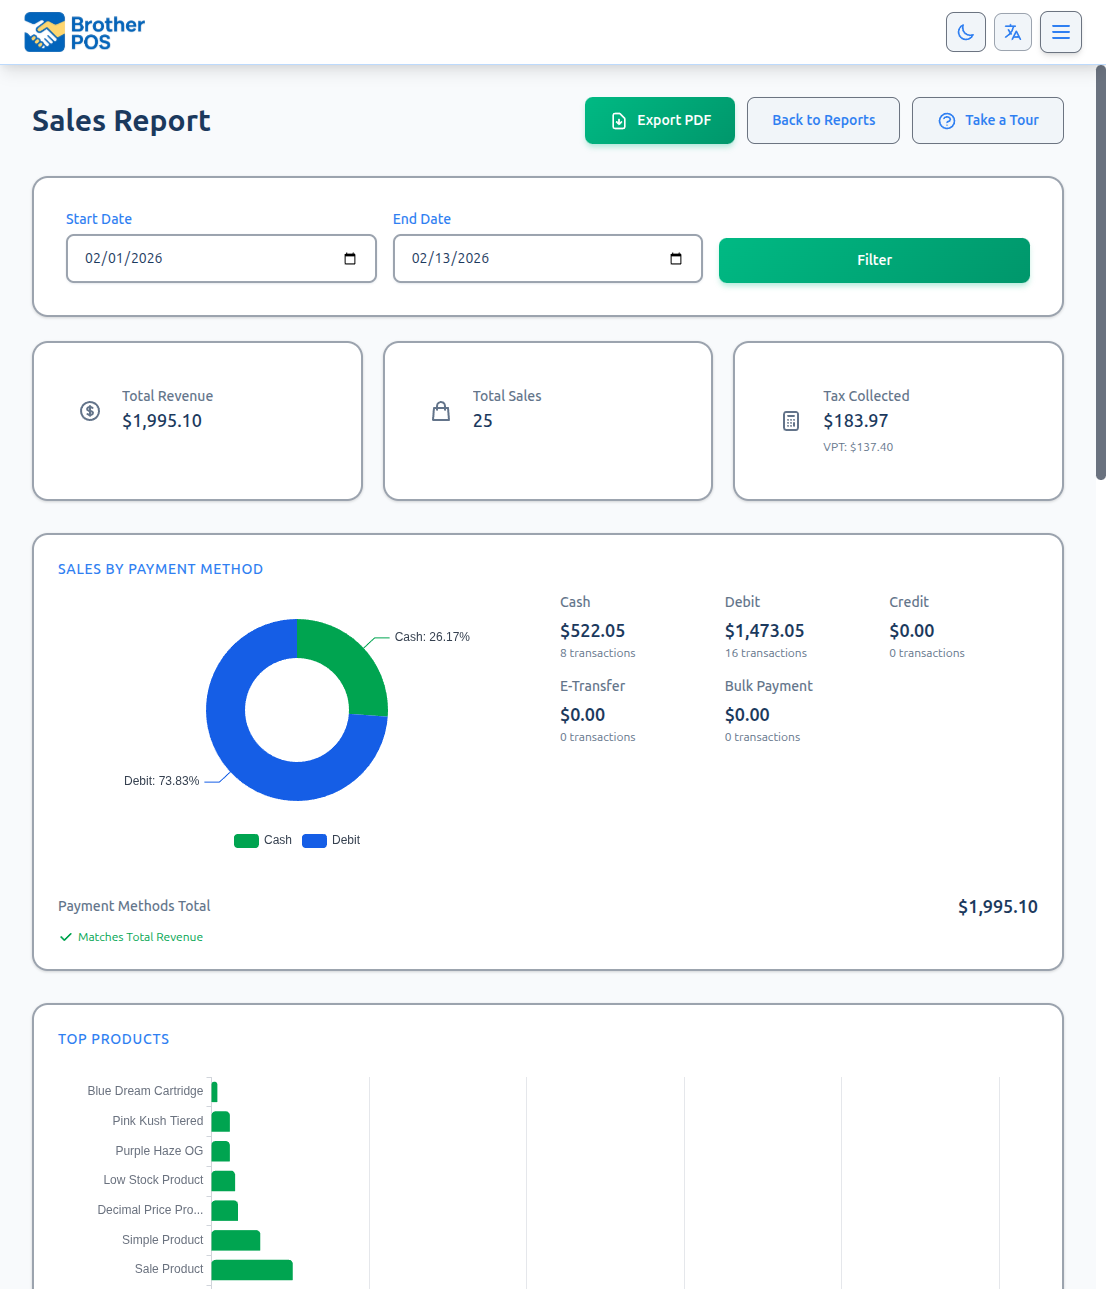
Understanding the Summary
The top section of the report displays key metrics for the selected period:
- Total Revenue -- The sum of all completed sale totals (after discounts, including tax).
- Total Sales -- The number of completed transactions.
- Total Tax Collected -- Combined tax from all completed sales.
Voided sales are excluded from all summary calculations. Only sales with a completed status are counted in revenue, tax, and transaction totals.
Sales Trend Chart
Below the summary, the report shows a sales trend chart for the selected date range. This visual representation helps you spot trends, compare periods, and identify patterns in your sales data.
The trend chart appears only when the selected range spans more than one day and there is revenue to plot. For a single day, use the End of Day Report instead.
Day / Week / Month / Year Toggle
A row of group-by pills sits in the top-right corner of the trend chart, letting you switch how the data is bucketed without changing your date range:
| Pill | What It Shows |
|---|---|
| Day | One point per calendar day (the default). |
| Week | Revenue rolled up by week, labeled "Wk of [date]". |
| Month | Revenue rolled up by month, labeled "[Month] [Year]". |
| Year | Revenue rolled up by year. |
Click any pill to re-bucket the chart. All four views reconcile to the same period total -- only the grouping changes, never the underlying numbers.
Use Day for short ranges to compare individual days, and switch to Month or Year when you select a long range (e.g., a full year) so the chart stays readable.
Revenue by Kind
Below the summary cards, the Revenue by Kind card splits the period's revenue across three line-item categories:
- Product Revenue -- Sales of catalog products (anything with a SKU and inventory). This is the bulk of revenue for a typical retail store.
- Service Revenue -- System-generated service charges with no inventory impact: golf green fees, cart fees, lodging unit-nights, banquet add-ons, etc. These appear on stores running the golf, lodging, or service-jobs features.
- Manual Entries -- One-off charges typed in by a clerk on the POS using the "Manual Item" button (e.g., a delivery fee, a custom charge, a payout).
Each column shows the dollar total and the percentage of total revenue. The card hides itself entirely when every kind is $0 (e.g., a blank date range).
The breakdown uses the same date filter and excludes voided line items. Numbers across the three cards always sum to the line-item subtotal for the period (tax is shown separately in Tax Collected).
Payment Method Breakdown
The payment method section shows how customers paid during the selected period.
| Payment Method | What It Tracks |
|---|---|
| Cash | Physical cash transactions |
| Debit | Debit or credit card payments processed on the payment terminal |
| E-Transfer | Interac e-transfer payments |
| Store Credit | Payments made using a customer's store credit balance |
| Gift Card | Gift card redemptions |
| House Account | B2B house account charges |
| Bulk Payment | Wholesale and bulk order payments |
| Split | Transactions paid with multiple methods |
Each method shows the number of transactions and the total dollar amount.
A split payment counts as a single transaction. The split total appears under Split, but the individual cash and card portions are also reflected in their respective categories. The Payment Method Breakdown therefore shows the full picture of how money flowed into your register.
Transactions Table
The bottom section lists individual transactions for the selected period:
- Receipt Number -- The unique transaction identifier.
- Date/Time -- When the sale was completed.
- Cashier -- The user who processed the sale.
- Payment -- How the customer paid.
- Status -- The sale status (e.g., completed, voided).
- Subtotal -- Pre-tax amount.
- Tax -- Tax collected.
- Total -- Final amount charged.
- Items -- Number of line items in the sale.
Click any row to view the full sale details including line items, discounts applied, and customer information.
Filtering and Searching
You can narrow down the transactions table:
- Search by receipt number -- Type a receipt number into the search field to find a specific transaction.
- Filter by clerk -- Select a specific user to see only their transactions.
- Filter by payment method -- Isolate cash-only or card-only sales.
Brand Performance
Above the category breakdown, the Brand Performance table rolls the period's sales up by product brand, mirroring the Category Performance table. It appears whenever the selected period has sales attributed to one or more brands.
| Column | What It Shows |
|---|---|
| Brand | The product brand. |
| Revenue | Total revenue for that brand in the period. |
| Items Sold | Number of units sold across the brand's products. |
| Sales | Number of transactions that included the brand. |
| Avg Sale Value | Average sale value for transactions including the brand. |
| % Revenue | The brand's share of total revenue for the period. |
Rows are sorted by revenue (highest first), and you can click any column header to re-sort the table.
Brand Performance answers "which suppliers/labels move the most product," while Category Performance answers "which product types drive revenue." Use them together to guide purchasing and shelf decisions.
Using Sales Data Effectively
Daily Review
Run the sales report at the end of each business day to verify that:
- Revenue matches your cash drawer count.
- No unexpected voided sales occurred.
- Discount usage was appropriate.
Weekly Comparison
Group by day over a two-week range to compare this week against last week. Identify which days are strongest and consider staffing accordingly.
Monthly Performance
Group by month over the past year to see long-term trends. This data supports decisions about inventory purchasing, staffing, and promotional campaigns.
The Sales Report gives you the "what." For the "why," pair it with:
- Category Performance to see which product categories drive revenue.
- Customer Analytics to understand who your top buyers are.
- Margin Analysis to check whether strong sales also mean strong profits.
What's Next?
- End of Day Report -- Generate a daily summary that includes all register sessions.
- Exporting Reports -- Download your sales data as CSV or PDF.
- Margin Analysis -- See whether your sales are translating into healthy margins.
Stores running gaming machines see an additional Gaming card on the Reports dashboard (shown only when slot machines are enabled). It covers per-machine cash payouts, totals over a date range, and CSV export. See Gaming for details.