Owner Dashboard
The Owner Dashboard is a dedicated portal for multi-store owners who operate two or more Brother POS locations. It provides aggregate analytics across all your stores, cross-store reports, staff management, stock transfers, and the ability to switch between store contexts without logging out.
Who Can Access the Owner Dashboard?
The Owner Dashboard is available to users identified as store owners via the ownership associations configured for your account. Store ownership is not a separate user role -- it is determined by the ownership associations linking users to their stores.
If you operate a single store, you do not need the Owner Dashboard. Use the standard Admin Panel instead. The Owner Dashboard is designed for owners managing multiple locations.
Accessing the Owner Dashboard
- Log in to Brother POS using your owner credentials.
- You are redirected to the Owner Dashboard.
- Alternatively, click Owner in the top navigation bar.
The Owner Dashboard has five main navigation tabs: Dashboard, Reports, Stores, Staff, and Stock Transfers.
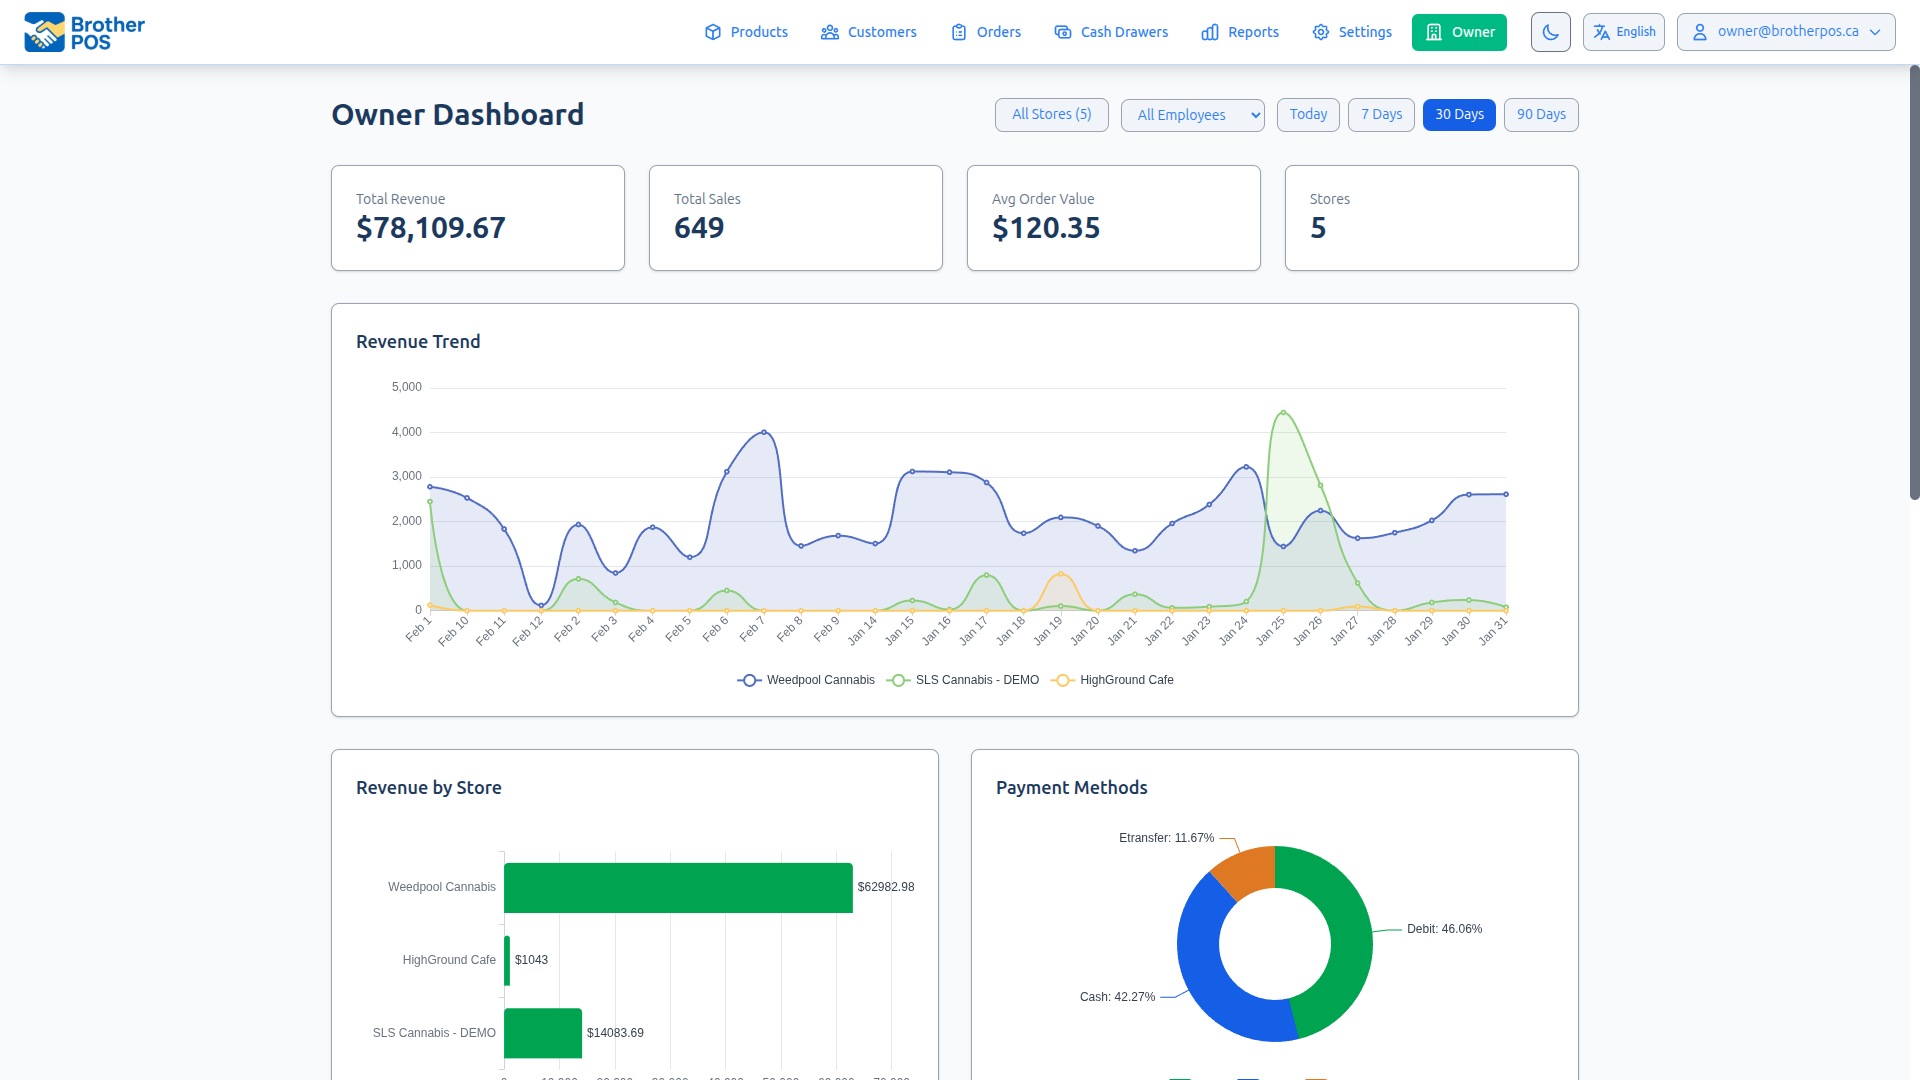
Dashboard Overview
The Owner Dashboard home page presents a high-level view of your business across all stores.
Summary Metrics
The dashboard displays two rows of KPI cards:
| Metric | Description |
|---|---|
| Total Revenue | Combined revenue across all selected stores for the chosen period. |
| Total Sales | Number of completed sales across all selected stores. |
| Avg Order Value | Average sale value across all selected stores. |
| Stores | Number of currently selected stores. |
| Total Refunds | Sum of refunded amounts and refund count. |
| Total Discounts | Sum of discount amounts and discounted sale count. |
| Net Revenue | Revenue minus refunds. |
| Discount Rate | Percentage of sales that included a discount. |
Filters
All dashboard sections respond to the same set of filters:
Store Picker -- A multi-select dropdown to filter by specific stores. By default all owned stores are selected. Check or uncheck individual stores to narrow the data.
Employee Filter -- When sales data is available, an Employee dropdown appears to filter all metrics by a specific cashier.
Date Range -- Select a preset period or enter custom dates:
- Today -- Data for the current day.
- 7 Days -- Last 7 days.
- 30 Days -- Last 30 days (default).
- 90 Days -- Last 90 days.
- Custom -- Pick a start and end date.
CSV Export -- Click the Export CSV button to download the dashboard data as a spreadsheet.
Dashboard Charts
Revenue Trend
A multi-line chart showing daily revenue for each selected store over the chosen period. Each store is represented by a separate colored line for visual comparison.
Revenue by Store
A horizontal bar chart comparing total revenue across selected stores.
Payment Methods
A donut chart showing the distribution of revenue by payment method (Cash, Debit, Credit, E-Transfer, etc.) across all selected stores.
Peak Hours
A bar chart showing sales volume by hour of day (0--23) across all selected stores. Use this to identify your busiest times and optimize staffing.
Sales by Weekday
A bar chart showing sales volume by day of the week (Monday--Sunday). Useful for identifying weekly patterns.
Top Categories
A horizontal bar chart showing the top 10 product categories by revenue across all selected stores.
Dashboard Tables
Store Performance Table
A sortable table listing each selected store with:
| Column | Description |
|---|---|
| Store | Store name. |
| Revenue | Total revenue for the period. |
| Sales | Number of completed sales. |
| Avg Order | Average order value. |
| WoW Trend | Week-over-week revenue change percentage. |
| Last Sale | Days since the most recent sale. |
| Health | Health status badge -- Healthy (green), Warning (yellow), or Inactive (red). |
| Enter Store | Button to switch into that store's admin context. |
Category Performance
A sortable table showing category-level detail: category name, revenue, quantity sold, and sales count.
Top Products
A ranked list of the top 10 selling products across selected stores, showing product name, total revenue, and quantity sold. Click to expand the full list.
Staff Performance
A ranked list of employees by total revenue and number of sales across selected stores.
Refund & Discount Breakdown
When refunds or discounts exist in the period, a per-store breakdown table appears showing returns count, refunded amount, discounted sales count, and discount amount for each store.
Inventory Summary
A table showing per-store inventory health: total products, low stock count, out of stock count, and total inventory value.
Reports
The Reports tab provides detailed cross-store analytics. All reports share the same filter controls (date range, store picker, employee filter) and offer CSV export.
Sales Report
Detailed sales analytics across all selected stores.
KPI Cards:
| Metric | Description |
|---|---|
| Total Revenue | Gross revenue for the period. |
| Total Sales | Number of completed transactions. |
| Avg Order Value | Mean transaction value. |
| Tax Collected | Total tax amount collected. |
| Total Discounts | Sum of all discounts applied. |
| Voided Sales | Count and dollar amount of voided transactions. |
| Net Revenue | Revenue minus refunds and voids. |
| Avg Daily Revenue | Revenue divided by number of days in the period. |
Charts: Revenue trend (multi-line by store), sales by hour, sales by weekday, payment methods (pie), top 10 categories.
Additional Filters: Sale status (Completed, Voided, All), payment method, receipt number search.
Transaction List: A paginated table (50 per page) of individual sales with full details including receipt number, cashier, items, payment method, and amounts.
Margin Analysis
Product-level profitability metrics across selected stores.
- Cost basis and sale prices per product.
- Markup percentages.
- Units sold, total revenue, and total margin.
- Paginated (50 products per page) with CSV export.
Inventory Turnover
Stock velocity analysis across selected stores.
- Product turnover rates and inventory velocity.
- Slow-moving product identification.
- Stock aging metrics.
- Paginated with CSV export.
Customer Analytics
Customer-level purchasing insights across selected stores.
- Top customers ranked by revenue and purchase frequency.
- Customer lifetime value metrics.
- Purchase pattern analysis.
- Multi-store customer consolidation.
- Paginated (50 per page) with CSV export.
Staff Performance
Employee performance metrics across selected stores.
- Overview mode -- Summary table of all staff showing revenue, sales count, average order value, and hourly rate.
- Detail mode -- Select a specific employee from the dropdown to see their individual sales transactions (paginated, 50 per page).
- Performance trend analysis.
- CSV export.
Daily Summary
Day-by-day operational summary across selected stores.
- Daily aggregated revenue, sales count, and average order value.
- Top products for each day.
- Staff breakdown per day.
- Cash drawer session summaries with opening/closing data.
- CSV export.
Stores
The Stores tab shows a card for each store you own.
| Element | Description |
|---|---|
| Store Name | The store's display name. |
| Subdomain URL | The store's URL (e.g., storename.brotherpos.ca). |
| Address | Physical address of the store. |
| Phone | Store phone number. |
| Enter Store | Button to switch into that store's admin context. |
Entering a Store
Click Enter Store on any store card (or in the dashboard's Store Performance table). You are switched into that store's admin panel with full access to all standard admin features, reports, and settings. An impersonation banner appears at the top to remind you which store you are viewing.
To return, click Stop Impersonating in the banner or navigate back to the Owner Dashboard.
Staff Management
The Staff tab lets you view and manage employees across all your stores.
Staff List
A combined list of all users across your owned stores, sorted by name. Each entry shows the employee's name, email, role, and store affiliation.
Staff Details
Click a staff member to view their details and current store assignments.
Managing Store Assignments
From the staff detail page you can:
- Add assignments -- Assign the employee to additional stores you own, with a specific role for each store.
- Update roles -- Change the employee's role at a particular store.
- Remove assignments -- Remove the employee's access to a store.
All changes are saved atomically. You can only manage assignments for stores you own.
Staff assignments let you share employees across multiple locations. An employee can have different roles at different stores (e.g., Manager at one store, Clerk at another).
Stock Transfers
The Stock Transfers tab lets you move inventory between your stores.
Transfer List
A paginated list (25 per page) of recent stock transfers involving your stores. Each entry shows the transfer number, source and destination stores, status, date, and item count.
Creating a Stock Transfer
- Click New Transfer.
- Select the Source Store and Destination Store from your owned stores.
- Add products to transfer:
- Select a product from the source store's catalog.
- Enter the quantity to transfer.
- Repeat for each product.
- Click Create Transfer.
The system deducts stock at the source store and adds it at the destination store. Product information (name, SKU, unit type) is snapshotted at transfer time for the audit trail.
Transfer Details
Click a transfer to view the full details including all items transferred, quantities, source and destination products, and the user who initiated the transfer.
Managing Your Stores
Adding a New Store
To request a new store:
- Contact Brother POS support.
- Once provisioned, the new store appears on your Owner Dashboard.
Store Settings
To modify a store's settings:
- Click Enter Store on the store card.
- Navigate to Settings and make your changes.
- Return to the Owner Dashboard via the owner menu or by clicking Stop Impersonating.
Security Considerations
The Owner Dashboard provides broad access across multiple stores. Keep these security practices in mind:
- Use a strong, unique password for your owner account.
- Log out when done -- Especially on shared devices.
- Review access regularly -- Ensure only authorized users have the store owner role.
- Monitor activity logs -- Check Activity Logs across your stores for unusual behavior.
Best Practices
- Check the dashboard daily -- A 2-minute daily review catches issues before they become problems.
- Compare stores weekly -- Use the Revenue by Store chart and Store Performance table to identify underperforming locations.
- Use reports for deep dives -- The dashboard gives you the overview; switch to the Reports tab for detailed analysis.
- Act on low stock alerts -- Low stock at one store may mean a stock transfer from another, not a new purchase order.
- Standardize where possible -- Use the same categories, products, and pricing across stores for meaningful comparisons.
- Delegate effectively -- Each store should have its own Admin or Manager handling day-to-day operations. Use the Owner Dashboard for oversight, not micromanagement.
- Review cash drawer sessions -- Discrepancies at any store should be investigated promptly.
- Export regularly -- Use CSV exports to build your own spreadsheets or share data with accountants.
Platform Owners Management
Super admins can manage store owners from the Platform Admin panel at /platform/. This includes:
- Viewing all store owners and their associated stores.
- Assigning or revoking ownership associations.
- Managing platform-wide analytics and store provisioning.
The Platform Admin panel is only accessible to users with the super_admin role. Store owners access the Owner Dashboard; platform management is a separate super-admin function.
What's Next?
- Sales Reports -- Detailed reporting within a specific store.
- Stock Adjustments -- Understand how stock changes are tracked.
- Stock Transfers -- Single-store transfer documentation.
- User Management -- Managing users within a single store.